
Why use market volume in my trading?
¿Sabes cómo identificar reversiones contundentes del mercado? ¿Cómo identificar falsos rompimientos en zonas de relevancia? Puedes desafiar los límites de tu operativa y desatar el increíble potencial del momentum en tus operaciones diarias a través del volumen.
Do you know how to identify strong market reversals? How to identify false breakouts in relevant areas? You can challenge the limits of your trading and unleash the incredible potential of momentum in your daily operations through volume.
Volume corresponds to the number of shares (for stocks), contracts (for futures), or lots (for CFDs and Forex) of a financial asset traded within a period. It is the main measure to assess the market’s intention towards an asset. Traders or investors can obtain a vast understanding of the money flow in a specific asset. Volume is decisive in identifying distribution or accumulation periods, determining the strength of a trend, the location of resistance or support levels, and confirming or denying reversal patterns.
In this blog, we will look at different cases in the NQ, the NASDAQ index futures.

*Many traders are influenced by the color of the bars in volume, thinking that green volume is bullish and red volume is bearish. However, volume alone cannot determine whether lots, contracts, or others are bullish or bearish. That’s why it is important to analyze with caution and always take into account the price zone or moment in the market.*
(It is recommended to set volume to a single color to avoid confusion.)

Using Volume to Identify Distribution or Accumulation
To understand distribution and accumulation periods, one must understand the market cycle and its phases.
1. Accumulation Phase:
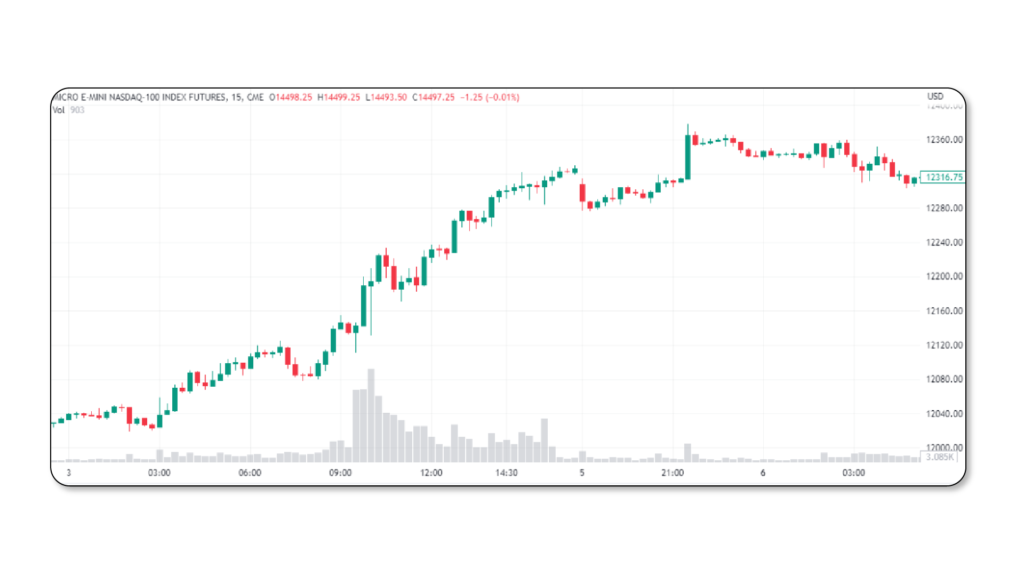
When the price of an asset drops, traders’ sentiment positions itself towards selling the asset, causing its value to continue declining. Prices keep falling consistently, creating a sideways market where prices remain within a range with high and constant volume. At the moment when the supply is exhausted and a price is reached where demand significantly outweighs supply, the price starts its bullish positioning. To identify when the price is exiting this accumulation zone, the volume at the range’s breakout is high and it undergoes a test with lower volume, indicating that there is not enough supply to meet the generated demand.

*In the chart, we can see that the price comes from a previous bearish trend. The supply starts to deplete, and an accumulation phase begins, marked by a range with minimum and maximum prices, highlighted as red and green zones representing supply and demand areas. The volume remains constant during most of the consolidation or sideways market. At the breakout moment, we observe high volume as it breaks the supply zone, indicating that the demand is surpassing supply and a bullish trend is likely to start. Subsequently, it tests the supply zone with reduced volume, indicating that the supply has dried up, increasing the probability of a bullish trend. This can be seen later on. In this example, we see that the breakout from the supply zone and the subsequent test are not precise or symmetrical, which is how the market behaves. Most of the time, these periods won’t be symmetrically shaped, making them more difficult to identify.
2. Bullish Trend:
The price begins to create a structure of higher lows and higher highs than the previous ones. The volume behaves very specifically: there is high volume during price increases and low volume during price decreases. This decrease becomes the bullish control point since it is unlikely that supply will surpass demand in this area. It becomes a relevant zone in price analysis because if the price retraces, it is very likely to reach these zones to find support from increased demand or to break that zone and change the trend.
The price starts to make higher lows and higher highs, and it can be seen that the volume is high during the upward moves and decreases during the downward moves, marking control points. It is important to consider that volume is relative, meaning it is considered high or low depending on the bars nearby. We can observe that the initial volumes are larger compared to the later ones, but it is more related to the time and other conditions. If we notice, the volume of the upward move is always greater than its subsequent test, so we should not compare current volumes with volumes from many candles ago.
In the end, the price begins to fall into another consolidation. It should be remembered that not every bullish trend is followed by distribution; the market does not always operate in a perfect cycle. It is possible that a re-accumulation phase occurs and the bullish trend continues.

In this case, the market exited an accumulation, a short bullish structure, returned to a sideways market, and formed a re-accumulation to continue the previous bullish trend.
3. Distribution Phase:
In this phase, the price is stagnant, and professional investors or traders start to take profits after the bullish trend. The volume in this range is high and constant. Similarly, the exit from this zone is triggered by a breakout below high volume, followed by a test with low volume, initiating the bearish trend of the price.

Here we notice that the price remains at equal lows and highs, with a constant volume. We observe that there is a high volume on the exit from the demand zone compared to the previous volume within the range. Following that, there is a test of that zone with reduced volume, indicating that the demand has been exhausted and a bearish trend is starting. In fact, we can see that two control points are formed, preceded by a decline with high volume, and the control points have lower volume. It represents a structured bearish trend.
4. Bearish Trend:
Similar to the bullish trend, the supply drives the price down in search of demand to find balance, creating a structure of lower lows and lower highs than the previous ones. The price declines are accompanied by high volume, and the tests are accompanied by low volume, indicating a control point.
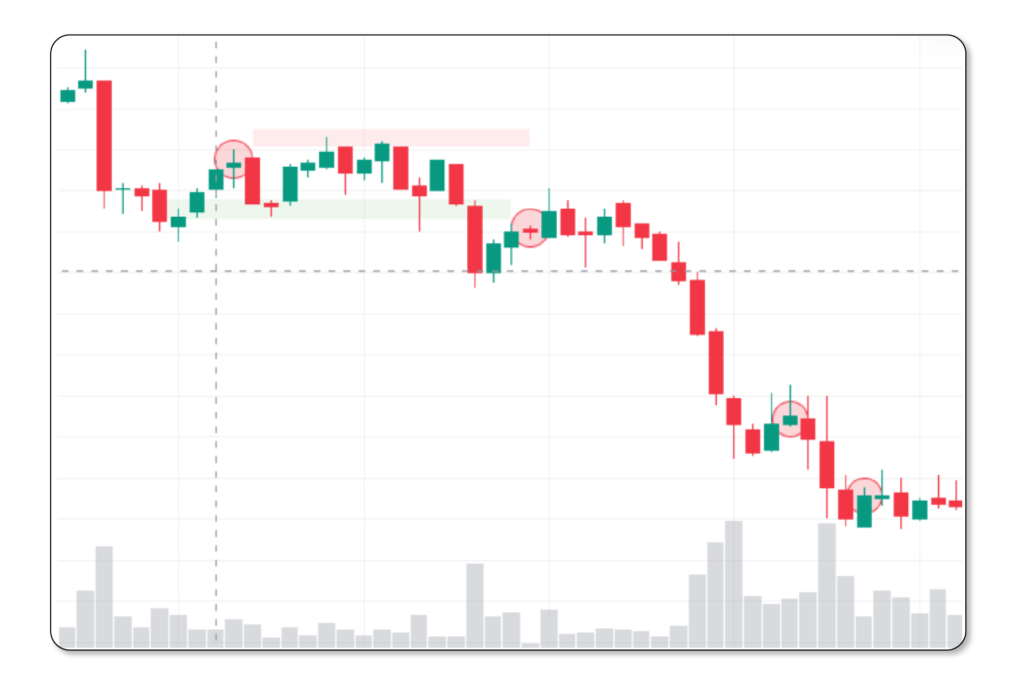
In this example, something different occurs. It is in a bullish trend, and we can confirm the strength of that trend because the volume during the downward moves is high compared to the volume at the control points (red circles). However, at the first control point, a small redistribution begins, which is completed by high volume testing the green demand zone with low volume. In this case, we can observe that the four market cycles can occur in any order and for short or long periods. The bearish trend continues with declines accompanied by high volume and control points with low volume.
In bullish or bearish trends, we can identify the strength of the trend through volume. Volume tends to dry up when the price reaches an accumulation or distribution zone, depending on the case. Additionally, volume allows us to locate important control points of interest for making continuation or reversal decisions in the market, which depend on each trader’s strategy.
5. Reversal Patterns:
Reversal patterns are crucial for identifying possible reversals in the market or the beginning of a new bullish or bearish trend. However, volume provides additional information to confirm if a reversal pattern is occurring at a given moment.
Double Top and Double Bottom:
This pattern forms when the price reaches a maximum level (double top) or a minimum level (double bottom) twice. These patterns are accompanied by high volume on the first touch of the first top or bottom and lower volume on the second touch. The analysis involves questioning whether, if the previous volume couldn’t break that zone, it is possible for lower volume to break the demand zone (for a double bottom) or the supply zone (for a double top). In most cases, the probability of breaking the zone with lower volume than before is very low.
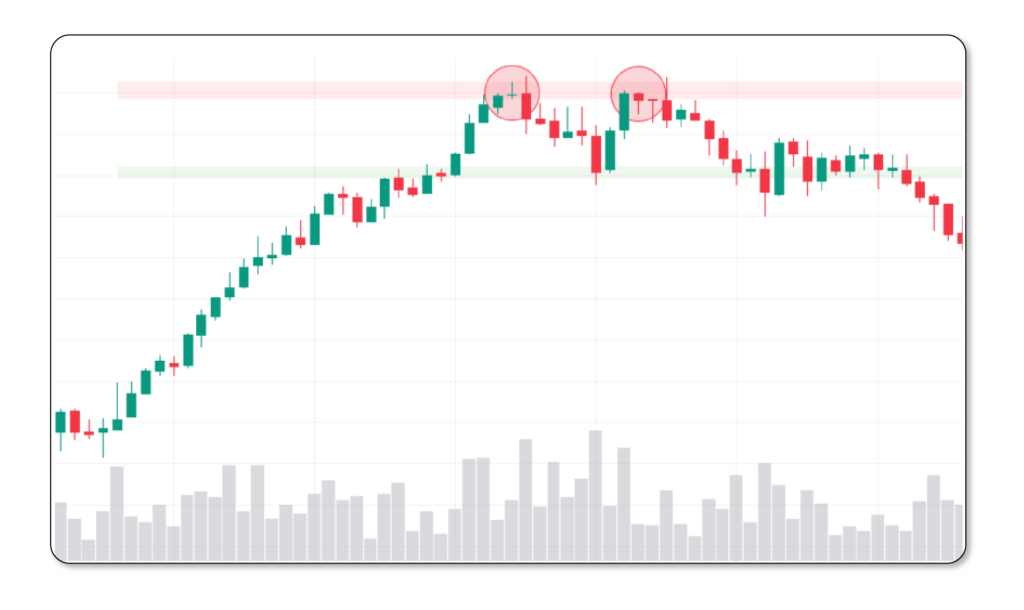
In this example, we enter a distribution phase. We see that on the first contact of the price with the red demand zone, there is high volume. Similarly, during the decline to the demand zone, the volume remains high and constant. On the subsequent contact with the top, the volume is high but doesn’t surpass or equal the volume of the first top in the movement. The volume has dried up along with the supply, making it highly likely that the price will reverse, as confirmed by the volume. Suppose the volume was higher than all the others. In that case, it could indicate accumulation, and the price might break that zone. Therefore, the reversal generated by the double top wouldn’t occur.
Head and Shoulders:
This is one of the most well-known patterns and is characterized by having three peaks, where the central peak (the head) is higher (or lower) than the other two peaks (the shoulders), indicating a possible reversal. Similar to the double top or double bottom, each peak is accompanied by lower volume. Thus, we ask ourselves the same question as with the previous pattern: Is it possible for lower volume to break the demand or supply zone?

In this case, the left shoulder has high volume, and the head represents a decline with greater depth than the left shoulder. From this, we can conclude that it is unlikely for the price to continue making lower lows if the volume during that decline was much lower than before. If higher volume couldn’t break that zone, it is improbable that lower volume will do so. We then observe the reentry, followed by the right shoulder, which has even lower volume than the other two peaks, confirming the reversal pattern.
The difference between this pattern and the previous one is that many traders are affected by the head. When they notice that the head has broken the preceding low or high with the first shoulder, traders take a position in favor of the head’s movement. However, it is highly unlikely that a breakout can occur with volume lower than that of the first shoulder. Therefore, we are likely witnessing market manipulation. The market reenters the zone, performs a test with the next shoulder using lower volume than the head and the first shoulder, and generates the possible reversal. To increase confirmation of these patterns, the use of candlestick patterns is recommended to reinforce the arguments for entering a long or short position.
6. V-Shaped Reversal:
This reversal pattern is accompanied by high volume and is generally generated with a candlestick pattern, such as an engulfing candle or a hammer candle for a long signal, or an inverted hammer candle for a short signal. It is also possible
For this pattern to occur and be confirmed by candlestick patterns such as three white soldiers or three black crows. These candles consist of three bullish candles at the lowest point of a bearish trend or three bearish candles at the highest point of a bullish trend, confirming the market reversal with an opposite intention. The V-shaped reversal is difficult to identify as it doesn’t come with a test like the double top or double bottom. Therefore, entering this reversal pattern, even if confirmed by volume, carries high risk.

In this example, we see a V-shaped reversal. It came from a bullish trend and immediately turned into a bearish trend. Without further information, it is challenging to anticipate this movement. The volume is high at the reversal moment. However, it can easily be mistaken for an upward move and a test with lower volume.
In conclusion, we know that there are various technical indicators in trading, but volume can sometimes anticipate future price movements, making it valuable when used correctly. However, it doesn’t mean that volume always behaves as it should. The market is unpredictable, and our job as traders is to speculate on price direction, but we will never be right 100% of the time. If we want to increase the probability of predicting price movements using the concepts taught, we can add other indicators such as momentum, volatility, trend, positioning, correlation analysis, etc
Alternatively, we can analyze the higher time frame zones. The market cycle repeats multiple times in lower time frames. Therefore, by identifying supply and demand zones in higher time frames through technical analysis or volume analysis. the probability of a reversal in the long term is much higher. If we know how to use volume along with multiple tools while maintaining good risk management and following our trading plan, our profits can increase significantly.

David Fiat
DevOps Engineer - MLSA - Flutter Developer