How to use correlation analysis to evaluate relationships between different assets?
Investing or trading in financial markets is always a challenging task if we want to stay ahead of market movements. One of the most important keys to making informed decisions and achieving profits in a variety of markets is the analysis of correlations between different assets.
This tool in investing or trading allows us to identify moments when the relationship between the price movements of two assets is very minimal or nearly zero, giving the impression that both assets move together in the same pattern and direction. Factors to consider include:
Esta herramienta en la inversión o el trading, nos permite identificar el momento en qué la relación de la variación entre los movimientos de dos activos es muy mínima o casi nula, dando la sensación de que ambos activos se mueven juntos en la misma estructura y en la misma dirección. Entre los factores a tener en cuenta están:
- Strength: There are strong correlations, where assets have a solid relationship in prices, and weak correlations, where the two assets have a less significant link.
- Direction: There are positive correlations, where if one asset has an upward trend, the other does too, and if one asset loses value, the other does as well. There are also negative correlations, where if one asset tends to rise, the other tends to fall, and vice versa.
The most direct way to identify correlations between two assets is through technical analysis. Here is a link to an article on technical analysis.
Importance of correlation for trading opportunities.
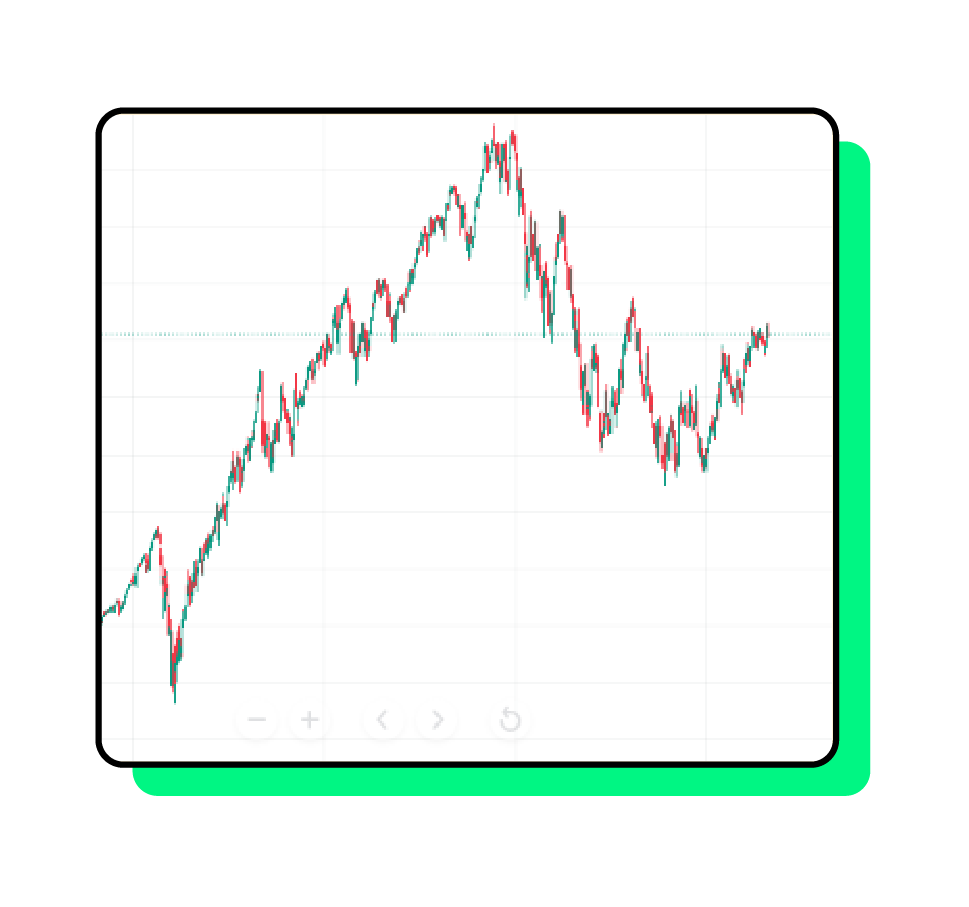
I am going to analyze two assets: the Nasdaq index and the price of Apple since it is the company with the highest weighting within the index.
Nasdaq Index graphic (1 day)

Apple INC graphic (1 day)

We can notice a relevant similarity in both charts, so much so that it can be implied that they are the same chart in certain time periods. This analysis is crucial for understanding economic changes, understanding the market’s current state, and identifying investment opportunities. For example, if tomorrow Apple’s stock starts to decline dramatically, being the company with the highest weighting in the Nasdaq, it is expected that the index will also begin its downward trajectory. However, there are correlations that may sometimes exhibit delays. Therefore, if Apple’s stock drops but the Nasdaq maintains a different trend, it is highly likely that at some point, the Nasdaq will fulfill the correlation and start its bearish movement. During this usually short period of delay, there may be speculation opportunities where short-term profits can be generated with a certain level of risk. Alternatively, one can withdraw operations or investments to avoid losses. The same applies to assets that exhibit inverse correlations.
Importance of correlation in avoiding losses
We have discussed the benefits of correlations between assets. However, they also have certain disadvantages, mostly in the long term. For example, if a company like Microsoft, which is the second-largest component of the Nasdaq index, is in an upward trend with favorable fundamentals and its technical analysis projects a consistent continuation of the trend. But at some point, all technology companies start experiencing a massive decline, causing the Nasdaq index to lose considerable value. It is highly likely that Microsoft’s stock may also start losing value, even though the company seems ideal for investment. Consequently, correlations can generate movements in assets that can be external. The only way to anticipate these events is to be aware of the most important correlations in the sector where we wish to invest. While everything may indicate that we should invest in an asset, the macro level may indicate the opposite, and correlation analysis can help us anticipate these changes.
Importance of correlation in preserving our money over time
Lastly, what happens with assets that are not easily correlated with any or almost any other assets? There are assets that are not easily affected by external factors, although they can impact the overall market themselves. These types of assets are highly valuable because they provide secure preservation of capital. The simplest example to understand is gold and precious metals in general. When assets lose correlation with others or with indices or the overall market, they become assets with high security, meaning that no external factor can trigger their loss. Another valuable example is cryptocurrencies, which initially did not have strong correlations with most assets. Bitcoin generally maintains correlations with the Nasdaq and the S&P 500, during which it ceases to be an asset that operates independently and may not be the best option for long-term capital preservation. However, there are moments when Bitcoin and other cryptocurrencies lose this correlation, and during those times, they become valuable investments that should be considered.
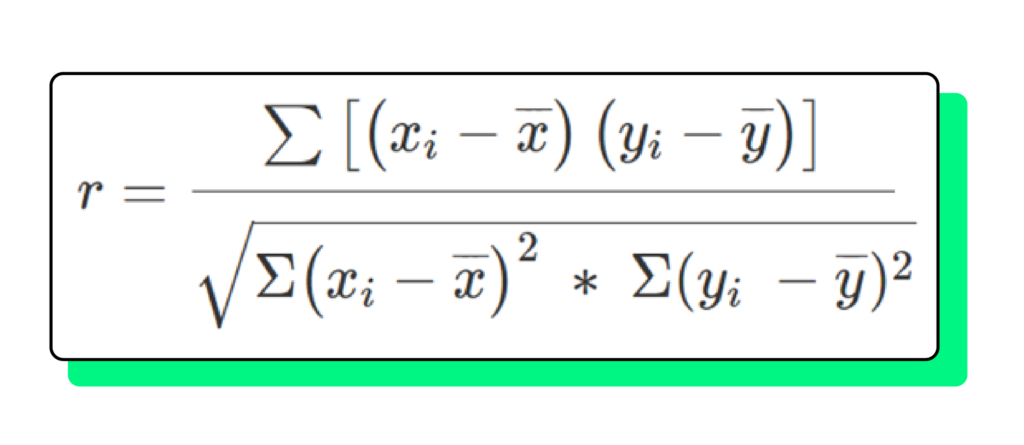
To manually calculate the correlation between two assets, there is a mathematical formula.

To avoid manual and extensive calculation of coefficients, there are various tools available. In Excel, if you have the prices or variations of the assets, you can calculate correlations more easily using a built-in function. For forex traders, tools like https://www.myfxbook.com/es/forex-market/correlation provide a correlation matrix for all currency pairs, allowing you to filter according to your needs and desired evaluation period. Another option is https://www.mataf.net/es/forex/tools/correlation, which allows you to apply different filters and analyze correlations between different forex pairs. For other markets, different trading platforms offer various technical analysis indicators. For example, you can use https://www.tradingview.com/script/uy1LMmRg-Correlation-Matrix-Heatmap-By-Leviathan/ to plot a matrix with desired assets. I recommend evaluating different combinations to find interesting correlations that provide value and opportunities for strategies based on strong correlations. There is also another indicator that allows you to plot the correlation between two assets over time, and the trader can choose which assets to compare. For example, you can graph Microsoft’s correlation with the NASDAQ using this indicator.

“We see that it maintains a positive correlation above a reference line. On the other hand, when evaluating a Tesla graph and the NASDAQ indicator.”

“We noticed that both assets have correlation at certain times but it is not constant like in Microsoft. Therefore, combining different assets and looking for correlations of all types is important to analyze the market in depth.
Interpretation of coefficients:
+- 96%, +-100% -> Perfect correlation
+- 85%, +-95% -> Strong correlation
+- 70%, +-84% -> Significant correlation
+- 50%, +-69% -> Moderate correlation
+- 20%, +-49% -> Weak correlation
+- 10%, +-19% -> Very weak correlation
+- 9%, +-0% -> Null correlation
It is important to identify the strength of the correlation coefficient in order to make decisions between assets. If a correlation is moderate, it is riskier to predict opportunities in the market than if the correlation is perfect.
In conclusion, identifying correlations gives us a broader view of the market. It allows us to make investment decisions, anticipate the market in certain occasions, and learn about interesting assets to invest in, always considering our risk profile and the market that interests us.”

David Fiat
DevOps Engineer - MLSA - Flutter Developer


